बाजार में सब कुछ price action पर चलता है।
Analysis is mastery of Observation.
Successful trading is mastery SELF.
कोई भी कंपनी हो, हम हमेशा केवल price देखते हैं, कि price ऊपर जा रहा है या नीचे जा रहा है। हम कंपनी के बारे में कुछ जानने की कोशिश नहीं करते हैं। किसी भी स्टॉक को देखने के लिये Monthly, Weekly & Daily टाईमफ्रेम में सपोर्ट रेसिस्टेंस, ट्रेंड देखते हैं।
The master has failed more times, than the beginner has even tried.
हम लोग (Traders) निर्णय लेने के व्यवसाय में हैं, मतलब कि हमें रोज ही Buy ही Sell के लिये decision लेना होते हैं। Decision हमेशा ही सही नहीं हो सकते, परंतु अगर हम descpline follow करते हैं, किसी एक टेक्नीक को फॉलो करते हैं तो हमारे decision सही होने के chance ज्यादा हो जाते हैं, और गलत होने की probability कम हो जाती है।
The movement of the MARKET is the movement MASS Psychology.
किसी भी स्टॉक का Support & Resistance होता ही है।
इस दुनिया में रहने वाले हर प्राणी का एक pattern जरूर होता है। Trader
Charts are maps of collective human behavior.
Nothing gets plotted on a chart until people take action.
The art of Technical Analysis, is to identify a trend reversal at a relatively early stage and ride that trend, until the weight of the evidence shows or proves that the trend has reversed.
The farther back you can look, the farther forward you are likely to see. – Winston Churchill
इसलिये हमेशा हम किसी भी स्टॉक के price action को देखने के लिये historical data देखते हैं, हर स्टॉक का अपना अपना moving average, pattern होता है। अगर उस स्टॉक में काम करना है तो हमें उसे समझना जरूरी है। पर कोई तो ऐसा moving average होता ही होगा, जो हर स्टॉक के लिये काम करता ही होगा।
The index has corrected in every 2 year from the top.
These corrections are categorized –
- 11-17%
- 25-35%
- 40-60%
Historically, these corrections 13 to 21 months duration.
पिछले 20 वर्षों का data बताता है –
अक्टूबर नवंबर दिसंबर बाजार के लिये बढ़िया रहते हैं।
जनवरी, फरवरी, मार्च हमेशा ही bearish रहता है।
जब भी बाजार correct होता है तब वह उतनी ही तेजी से अपना high बनाता है।
जैसे कि मार्च 2020 – अक्टूबर 2020 के दौरान 39.57% correction हुआ था, परंतु केवल 18 महीनों में ही निफ्टी 147.69% बढ़ चुका था।
Rule of the Game –
Buy the strength and Exit the weakness
The stronger stocks always lead the market and forms new highs.
अगर benchmark स्टॉक 1% बढ़ता है तो Index 3-5% बढ़ता है, यह नियम 70% स्टॉक follow करते हैं। वहीं अगर Index 5% गिरता है तो benchmark स्टॉक 10% तक गिर जाते हैं।
Identify the stock which never made a lower low (1 low is ok) on a monthly chart / weekly for short term.
Every time, buy a stock only at life time highs.
कभी बाजार में आप अपना पैसा नहीं loss करेंगे You never lost money in market.
Exit –
- जब भी स्टॉक अपने पिछले weekly average से नीचे आये तो partially profit बुक कर लें।
- पिछले monthly average से नीचे आये तो 100% exit कर लें।
- अगर अपने top से 5-8% correct होता है तो exit कर लें।
Intraday or Short term Exit Rules
- Exit is Stop loss – You are a professional trader
- Trailing Stop loss (Small or Big profit)
- Booking profit at Target – You are GOD.
You buy high sell higher, you will never loose the money in market.
High profits when adding winning positions.
बाजार में 4 Stages होते हैं –
- Stage 1 – Accumulation – Breakout – Consolidation / Pull Back – continuation
- Stage 2 – Markup (Where retailers get in) – Termination
- Stage 3 – Distribution – Holding
- Stage 4 – Mark Down – Break Out – Consolidation / Pull Back – Continuation
हमेशा कोशिश करना है कि हम Stage 2 में ऐसे स्टॉक में Entry करें।
Step one –
Identify 3 most popular patterns –
Flat Base
Cup with handle or without handle
Double Bottom
When a market is in sideways (At high) or in a Downtrend – (Where to buy)
- Fall at least 60% from the top – If 70-80% then very good to invest.
- Longer the Base sharper the move – If consolidating for 6-9 months then move very sharp for up side.
- Low Volume
- Oscillates around 40/30 week average, several months.
- Price makes higher low
- Before the breakout 40/30 WMA truns up.
Tata Motors as an example corrected till 90% then see the move in 20 weeks.
Deepak Niterate –
Step Two –
A Breakout
- Look for volume confirmation
- Above – Average Volume (40-50%)
- Better Relative Strength (RS) 60
Ashok Leyland
Atul – Moving Higher & Higher
Aarti Drugs
Step Three –
Post Breakout
- Failed Breakout / below the Breakout level
- Breakout Retest / Run Up
- Buy at 1-5% above the Breakout level
BalkrisInd
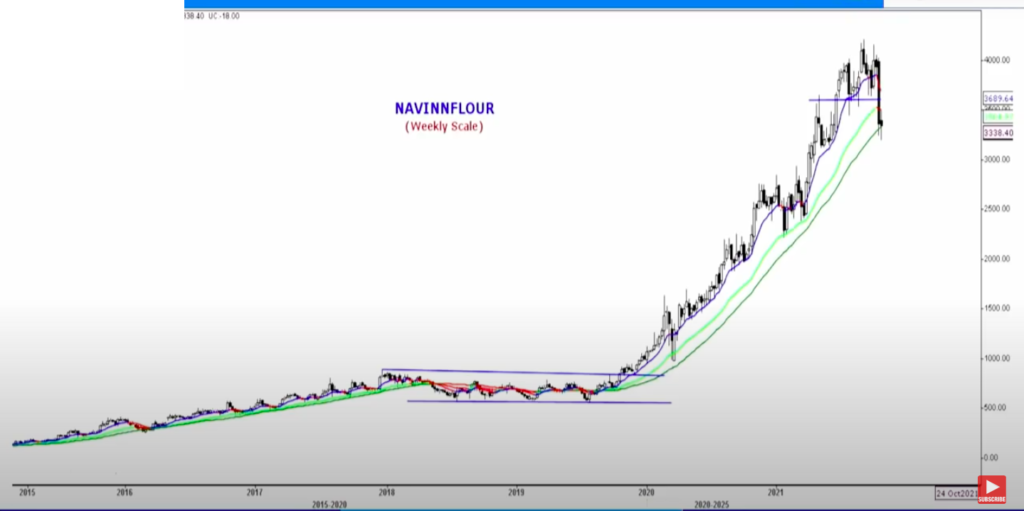
Step Four –
The Run up
- Sharp Run Up – Longer the base / consolidation.
- 50DMA / 10WMA, below the price (Exit)
- Stronger Stocks always above this line.
- A dip below this line with lower volume ignore. (Some big distribution is happening)
NavineFlour
Step Five –
The Toping
- Slicing the 50DMA / 10WMA
- 50DMA / 10WMA with volume / distribution day.
- 7-8% from the top
- Partial exit @25% gains, if closes above then previous month then exit fully.
अगर 50 DMA से नीचे आ जाता है तो इसका मतलब होता है कि अब correction stage में हैं।
The Setup – (Interaday / Positional) Moving Average Ribbon
- Use 3 same period averages
- Use 34 EMA of close
- Use 34 EMA of high
- Use 34 EMA of LOW
- On bottom – Apply MACD line only.
जब भी आपको अपने ऐसे स्टॉक में 25% का profit हो रहा हो तो, अपना profit निकाल लें और वह profit ऐसे किसी और स्टॉक में invest कर दें। इस प्रकार से long term का portfolio बना पायेंगे।
निफ्टी नीचे जा रहा है तो इसका मतलब यह नहीं कि सारे स्टॉक्स भी उसके साथ correct होंगे, 30% स्टॉक्स हमेशा benchmark के opposite काम करेंगे।
Target निकालने के लिये Fibonacci retracements का उपयोग करें।