How to spot a bull trap. A bull trap is a false signal of a market reversal. Learn how to avoid falling for this trap and protect your investments.
A bull trap is a situation where traders are misled into buying an asset that is breaking out above a resistance level, only to see the price reverse and fall below the resistance level again. This can result in losses for the buyers who entered the market too early or did not exit in time. To spot a bull trap, you can use some of the following methods:
Look for signs of weakening momentum in the bullish trend, such as shorter candlesticks, lower volume, or lower highs.
Use technical indicators such as the relative strength index (RSI) or the moving average convergence divergence (MACD) to identify overbought conditions or divergence between the price and the indicator.
Wait for confirmation of the breakout, such as a close above the resistance level on a higher time frame, or a retest of the resistance level as support.
Use stop-loss orders to protect your position in case of a reversal, and consider using trailing stops to lock in profits as the price moves in your favor.
Bull traps can be tricky to avoid, but by using these methods, you can increase your chances of identifying them and trading them successfully.
Golden Cross तकनीकी चार्ट पैटर्न कहलाता है। जो शेयर बाजार में बड़ी तेजी की संभावना का संकेत देता है। यह तब होता है जब एक शॉर्ट टर्म मूविंग एवरेज (जैसे 50-Days moving average) जब एक लाँग टर्म मूविंग एवरेज को cross करती है (जैसे 200- Days moving average) से ऊपर हो जाती है। यह संकेत देता है कि वह शेयर या बाजार इंडेक्स का movement bearish से bullish की ओर shift हो रहा है, और आगे यही trend मतलब कि upward direction ही रहने की संभावना है।
गोल्डन क्रॉस को long term bull market के लिये बाजार का एक विश्वसनीय indicator माना जाता है, क्योंकि इससे पता चलता है कि buyers की strength sellers की तुलना में अधिक है। मूविंग एवरेज सपोर्ट लेवल्स के जैसा काम करती है, जिसका अर्थ है कि वे कीमत को उनके नीचे गिरने से रोकते हैं। मूविंग एवरेज की अवधि जितनी लंबी होगी, उसके सपोर्ट का स्तर उतना ही मजबूत होगा। इसलिए, जब 50- Days Moving Average, 200- Days Moving Average को cross करता है, तो इसका मतलब है कि price ने एक मजबूत resistance को तोड़ दिया है, और एक नया uptredn बन गया है।
गोल्डन क्रॉस को किसी भी स्टॉक, इंडेक्स पर लगा कर देखा जा सकता है, और इसको अलग अलग timeframes में देखा जा सकता है, पैसे कि daily, weekly या monthly चार्ट पर। हालाँकि, सबसे ज़्यादा और अधिकतर सभी लोगों द्वारा देखे जाने वाला गोल्डन क्रॉस 50-day और 200-day moving averages है जो कि daily chart पर देखा जाता है।वह इसलिए कि ये दोनों moving averages मीडियम और लांग टर्म ट्रेंड को दिखाते हैं, और इसे कई ट्रेडर्स और निवेशक उपयोग करते हैं।
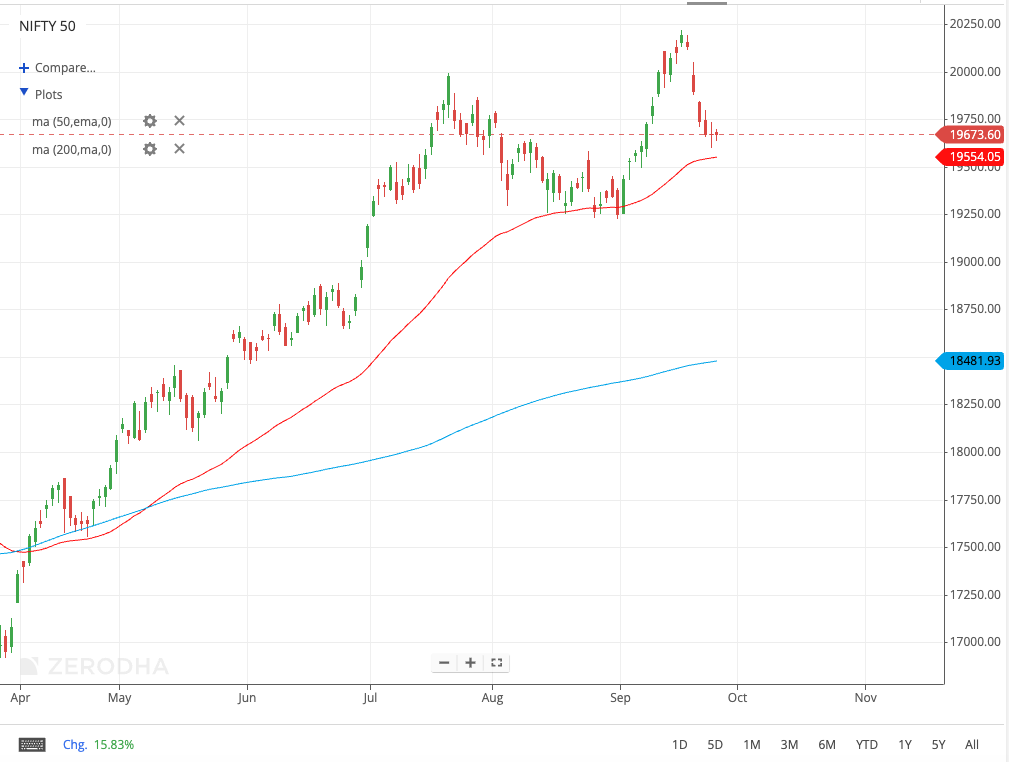
गोल्डन क्रॉस का एक उदाहरण चार्ट में दिखाया गया है, जो मई 2023 से सितंबर 2023 तक निफ़्टी 50 इंडेक्स को दिखा रहा है। लाल रेखा 50- day moving average को दिखा रही है और नीली रेखा 200- day moving averages है। गोल्डन क्रॉस मई 2023 में हुआ, जब लाल रेखा नीली रेखा से ऊपर चली गई। इसने अप्रैल 2023 में शुरू हुई downtrend की समाप्ति और सितंबर 2023 तक चलने वाले एक नए uptrend की शुरुआत को दिखाया गया है। Crossover के point से सितंबर 2023 में टॉप तक index लगभग 15% बढ़ गई।
हालाँकि, गोल्डन क्रॉस को पूरी तरह से perfect indicator भी नहीं कहा जा सकता है। इसकी कुछ कमियाँ और limitations हैं, जो कि निवेशकों को पता होना चाहिए।
उनमें से कुछ हैं: –
– गोल्डन क्रॉस बहुत धीमा indicator है, मतलब कि क्रॉसओवर के पहले ही trend बदल चुका है पर चार्ट पर बाद में दिखता है। जब तक निवेशक लेने जाता है तब तक कीमत पहले ही काफी बढ़ चुकी होती है और कुछ possible profit नहीं मिलता।
– गोल्डन क्रॉस गलत सिग्नल भी दे सकता है, जिसका अर्थ है कि यह ट्रेंड change का signal दे देगा परंतु दरअसल ऐसा होता नहीं है। और कई बार moving average के पास price पर ज़बरदस्त pressure होता है, जिससे price बार-बार cross और uncross होता रहता है। इससे भ्रम की स्थिति हो जाती है, जिसके परिणामस्वरूप उन ट्रेडर्स का भारी नुक़सान उठाना पड़ता है, जो crossover को आँखें बंदकर follow करते हैं।
– गोल्डन क्रॉस इस बारे में कोई जानकारी नहीं देता है कि नया trend कितने समय तक चलेगा या कितनी दूर तक चलेगा। यह केवल यह बताता है कि trend बदलाव। इसलिए, ट्रेडर्स और निवेशकों को गोल्डन क्रॉस के संकेतों को confirm करने के लिए अन्य indicators और टूल्स का भी उपयोग करना चाहिये।जैसे ट्रेंड लाइन, support & resistance levels, वॉल्यूम एनालिसिस और जोखिम प्रबंधन तकनीकों (Risk Management Techniques) का उपयोग करना चाहिए।